
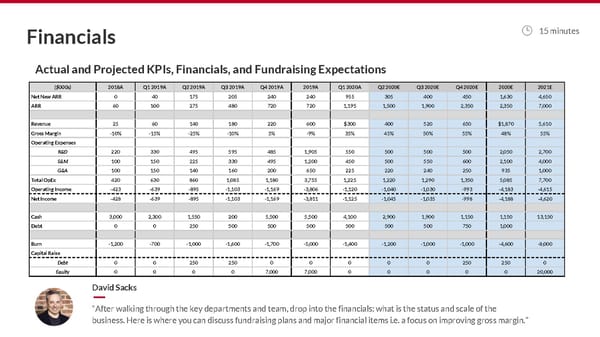
Financials 15 minutes Actual and Projected KPIs, Financials, and Fundraising Expectations ($000s) 2018A Q1 2019A Q2 2019A Q3 2019A Q4 2019A 2019A Q1 2020A Q2 2020E Q3 2020E Q4 2020E 2020E 2021E Net New ARR 0 40 175 205 240 240 955 305 400 450 1,630 4,650 ARR 60 100 275 480 720 720 1,195 1,500 1,900 2,350 2,350 7,000 Revenue 25 60 140 180 220 600 $300 400 520 650 $1,870 5,610 Gross Margin -10% -15% -25% -10% 5% -9% 35% 45% 50% 55% 48% 55% Operating Expenses R&D 220 330 495 595 485 1,905 550 500 500 500 2,050 2,700 S&M 100 150 225 330 495 1,200 450 500 550 600 2,100 4,000 G&A 100 150 140 160 200 650 225 220 240 250 935 1,000 Total OpEx 420 630 860 1,085 1,180 3,755 1,225 1,220 1,290 1,350 5,085 7,700 Operating Income -423 -639 -895 -1,103 -1,169 -3,806 -1,120 -1,040 -1,030 -993 -4,183 -4,615 Net Income -428 -639 -895 -1,103 -1,169 -3,811 -1,125 -1,045 -1,035 -998 -4,188 -4,620 Cash 3,000 2,300 1,550 200 5,500 5,500 4,100 2,900 1,900 1,150 1,150 13,150 Debt 0 0 250 500 500 500 500 500 500 750 1,000 Burn -1,200 -700 -1,000 -1,600 -1,700 -5,000 -1,400 -1,200 -1,000 -1,000 -4,600 -8,000 Capital Raise Debt 0 0 250 250 0 0 0 0 0 250 250 0 Equity 0 0 0 0 7,000 7,000 0 0 0 0 0 20,000 David Sacks “After walking through the key departments and team, drop into the financials: what is the status and scale of the business. Here is where you can discuss fundraising plans and major financial items i.e. a focus on improving gross margin.”
 The Sacks SaaS Board Deck Page 21 Page 23