
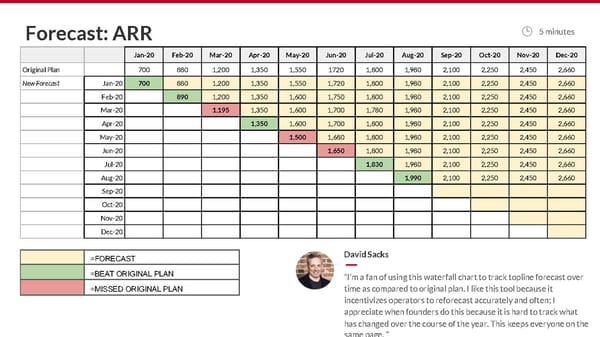
Forecast: ARR 5 minutes Jan-20 Feb-20 Mar-20 Apr-20 May-20 Jun-20 Jul-20 Aug-20 Sep-20 Oct-20 Nov-20 Dec-20 Original Plan 700 880 1,200 1,350 1,550 1720 1,800 1,980 2,100 2,250 2,450 2,660 New Forecast Jan-20 700 880 1,200 1,350 1,550 1,720 1,800 1,980 2,100 2,250 2,450 2,660 Feb-20 890 1,200 1,350 1,600 1,750 1,800 1,980 2,100 2,250 2,450 2,660 Mar-20 1,195 1,350 1,600 1,700 1,780 1,980 2,100 2,250 2,450 2,660 Apr-20 1,350 1,600 1,700 1,800 1,980 2,100 2,250 2,450 2,660 May-20 1,500 1,680 1,800 1,980 2,100 2,250 2,450 2,660 Jun-20 1,650 1,800 1,980 2,100 2,250 2,450 2,660 Jul-20 1,830 1,980 2,100 2,250 2,450 2,660 Aug-20 1,990 2,100 2,250 2,450 2,660 Sep-20 Oct-20 Nov-20 Dec-20 =FORECAST David Sacks =BEAT ORIGINAL PLAN “I’m a fan of using this waterfall chart to track topline forecast over =MISSED ORIGINAL PLAN time as compared to original plan. I like this tool because it incentivizes operators to reforecast accurately and often; I appreciate when founders do this because it is hard to track what has changed over the course of the year. This keeps everyone on the same page. ”
 The Sacks SaaS Board Deck Page 15 Page 17