
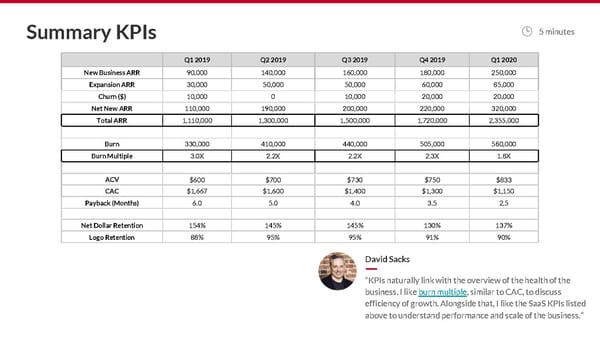
Summary KPIs 5 minutes Q1 2019 Q2 2019 Q3 2019 Q4 2019 Q1 2020 New Business ARR 90,000 140,000 160,000 180,000 250,000 Expansion ARR 30,000 50,000 50,000 60,000 85,000 Churn ($) 10,000 0 10,000 20,000 20,000 Net New ARR 110,000 190,000 200,000 220,000 320,000 Total ARR 1,110,000 1,300,000 1,500,000 1,720,000 2,355,000 Burn 330,000 410,000 440,000 505,000 580,000 Burn Multiple 3.0X 2.2X 2.2X 2.3X 1.8X ACV $600 $700 $730 $750 $833 CAC $1,667 $1,600 $1,400 $1,300 $1,150 Payback (Months) 6.0 5.0 4.0 3.5 2.5 Net Dollar Retention 154% 145% 145% 130% 137% Logo Retention 88% 95% 95% 91% 90% David Sacks “KPIs naturally link with the overview of the health of the business. I like burn multiple, similar to CAC, to discuss efficiency of growth. Alongside that, I like the SaaS KPIs listed above to understand performance and scale of the business.”
 The Sacks SaaS Board Deck Page 10 Page 12