The Sacks SaaS Board Deck
Board Meeting Q1 2020
Board Meeting Q1 2020 April 16, 2020 David Sacks “For sales-driven companies, schedule your board meeting a couple weeks after the quarterly close, so the data is Your company name conclusive and fresh. You don’t want to be speculating about how the quarter is going to go. You want to know.”
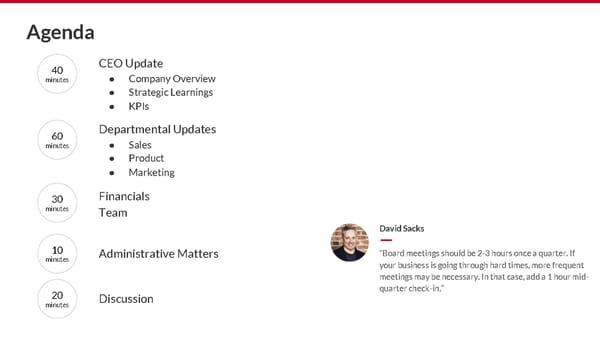
Agenda 40 CEO Update minutes ● Company Overview ● Strategic Learnings ● KPIs 60 Departmental Updates minutes ● Sales ● Product ● Marketing 30 Financials minutes Team David Sacks 10 Administrative Matters “Board meetings should be 2-3 hours once a quarter. If minutes your business is going through hard times, more frequent meetings may be necessary. In that case, add a 1 hour mid- 20 quarter check-in.” minutes Discussion
CEO Update 5 minutes What’s Working What’s Not Working ● Recent or near term wins ● Recurring processes that are broken ● New processes delivering better than ● Issues that need solving expected ● Recent negative development ● Milestones or company achievements ● Long term strategy or product concerns ● Product traction or positive media ● Existential risks recognition ● Competitive threats ● New major hires or team victories David Sacks “This slide is your 30,000 foot strategic update. What’s going well, what’s not going well. What’s keeping you up at night.”
Strategic Learnings 5 minutes What’s the “diff” on the investor presentation (i.e. if you were to write your investor presentation today, what would be different)? ● Initially believed A about market; now know B ● Expected early adopters to be X, but turns out they are Y and Z ● Forecasted growth at certain speed, realized that was too slow/too fast ● Changes in the competitive landscape David Sacks “What have you learned about the market since the last board meeting?”
Company Priorities 5 minutes What are the company’s top 3-5 priorities this quarter? ● Priority 1 ● Priority 2 ● Priority 3 ● Priority 4 ● Priority 5 David Sacks “In light of the strategic learnings, CEOs should constantly be prioritizing and reprioritizing the most important initiatives. If you do OKRs, then this list of priorities can provide a first draft of your quarterly objectives.”
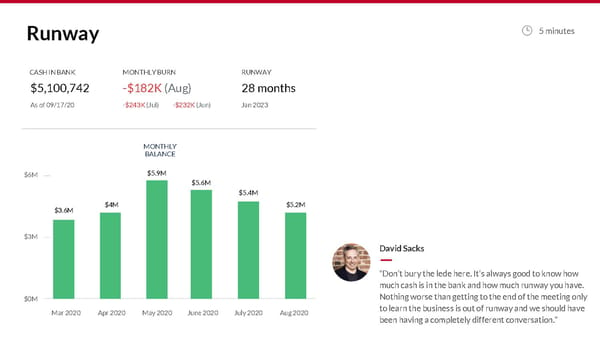
Runway 5 minutes CASH IN BANK MONTHLY BURN RUNWAY $5,100,742 -$182K(Aug) 28 months As of 09/17/20 -$243K(Jul) -$232K(Jun) Jan 2023 MONTHLY BALANCE $6M $5.9M $5.6M $5.4M $4M $5.2M $3.6M $3M David Sacks “Don’t bury the lede here. It’s always good to know how much cash is in the bank and how much runway you have. $0M Nothing worse than getting to the end of the meeting only Mar 2020 Apr 2020 May 2020 June 2020 July 2020 Aug 2020 to learn the business is out of runway and we should have been having a completely different conversation.”

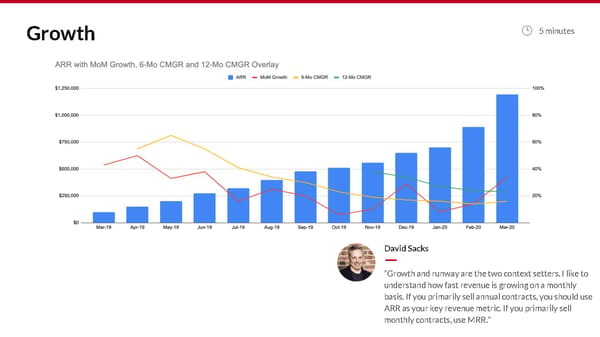
Growth 5 minutes David Sacks “Growth and runway are the two context setters. I like to understand how fast revenue is growing on a monthly basis. If you primarily sell annual contracts, you should use ARR as your key revenue metric. If you primarily sell monthly contracts, use MRR.”

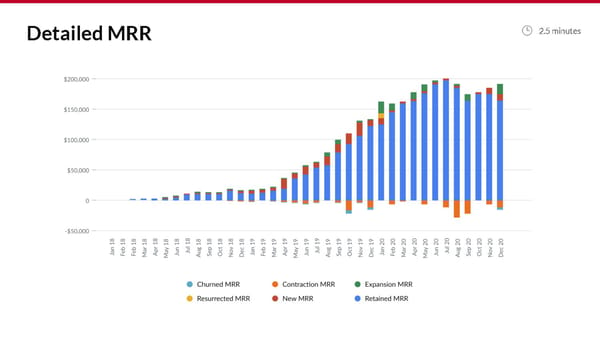
Detailed MRR 2.5 minutes

Cohorted Retention 2.5 minutes Month 0 Month 1 Month 2 Month 3 Month 4 Month 5 Month 6 Month 7 Month 8 Month 9 Month 10 Month 11 Month 12 Dec 19 100% 100% 100% 100% 100% 100% 100% 100% 100% 100% 100% 100% 100% Jan 20 100% 99% 96% 93% 109% 109% 101% 107% 107% 107% 107% 108% Feb 20 100% 100% 100% 100% 100% 100% 100% 100% 100% 100% 100% Mar 20 100% 100% 100% 100% 100% 64% 64% 64% 64% 64% Apr 20 100% 100% 100% 100% 100% 100% 100% 100% 93% May 20 100% 100% 100% 100% 100% 100% 100% 100% Jun 20 100% 99% 99% 99% 99% 99% 99% Jul 20 100% 56% 56% 56% 56% 56% Aug 20 100% 235% 275% 183% 103% Sep 20 100% 100% 100% 83% Oct 20 100% 64% 37% Nov 20 100% 13% Dec 20 100% Avg $ Retention 100% 92% 91% 89% 89% 88% 88% 88% 88% 88% 89% 88% 86%
Engagement 10 minutes Top 10 Customers Users DAU/MAU DAU/WAU Customer 1 240 38% 72% Customer 2 190 39% 67% Customer 3 180 36% 69% Customer 4 180 31% 55% David Sacks Customer 5 135 30% 63% Customer 6 130 27% 86% “The simplest metrics for engagement are DAU/WAU Customer 7 125 28% 71% and DAU/MAU. Look at the crests to understand Customer 8 120 42% 60% workday usage. It’s also helpful to see engagement for Customer 9 100 20% 100% your top 10 customers.” Customer 10 90 17% 67%
Summary KPIs 5 minutes Q1 2019 Q2 2019 Q3 2019 Q4 2019 Q1 2020 New Business ARR 90,000 140,000 160,000 180,000 250,000 Expansion ARR 30,000 50,000 50,000 60,000 85,000 Churn ($) 10,000 0 10,000 20,000 20,000 Net New ARR 110,000 190,000 200,000 220,000 320,000 Total ARR 1,110,000 1,300,000 1,500,000 1,720,000 2,355,000 Burn 330,000 410,000 440,000 505,000 580,000 Burn Multiple 3.0X 2.2X 2.2X 2.3X 1.8X ACV $600 $700 $730 $750 $833 CAC $1,667 $1,600 $1,400 $1,300 $1,150 Payback (Months) 6.0 5.0 4.0 3.5 2.5 Net Dollar Retention 154% 145% 145% 130% 137% Logo Retention 88% 95% 95% 91% 90% David Sacks “KPIs naturally link with the overview of the health of the business. I like burn multiple, similar to CAC, to discuss efficiency of growth. Alongside that, I like the SaaS KPIs listed above to understand performance and scale of the business.”
Sales Update
KPIs: Past Quarter 10 minutes Q1 2020 Closed Deals Account Type Status New ARR Booked ● Last quarters’ new ARR by deals Alpha New W 80,000 Bravo New W 70,000 and contract size Charlie New W 100,000 ● New business vs. renewals Delta New L ● Expansion vs. contraction Echo Expansion W 10,000 Foxtrot Expansion W 20,000 ● Won vs. lost Golf Expansion L Hotel Renewal W 60,000 India Renewal W 50,000 Juliet Renewal L Kilo Contraction L -10,000 Lima Contraction L -10,000 Papa Churn L -20,000 David Sacks “Many of the KPIs tether off of sales, so next up review closed deals and pipeline for the upcoming quarter. Include color on deals both won and lost: what was the deciding factor, what was the friction, and what objections/features were missing?”
KPIs: Pipeline 10 minutes Account Stage Amount Probability Weighted Close Date Pipeline Metrics: Amount ● Weighted pipe size: $ amount * Alpha Lead $100,000 20% $10,000 Aug 20 Bravo Lead $50,000 20% $7,500 Jul 20 probability dependent on stage Charlie Lead $75,000 20% $18,750 Jul 20 ● Weighted Total Pipeline for the Delta Lead $150,000 20% $37,500 Jul 20 upcoming quarter Echo Qualification $200,000 40% $80,000 Jun 20 Foxtrot Qualification $75,000 40% $30,000 Jun 20 ● Dive in on top accounts/targets Golf Qualification $150,000 40% $60,000 May 20 Hotel Demo $75,000 60% $45,000 May 20 India Demo $150,000 60% $90,000 May 20 Juliet Negotiation $200,000 80% $160,000 Apr 20 Kilo Negotiation $150,000 80% $120,000 Apr 20 Lima Proposal $120,000 90% $108,000 Apr 20 Total Weighted Sales $1,120,000 $693,000 Pipeline in Q2
KPIs: Pipeline 10 minutes Pipeline Overview Stage # of Accounts QoQ Change % Weighted Total Pipeline ($000s) Interested 1,000 25% n/a Lead 470 30% 400 Qualification 200 40% 600 Demo 80 50% 400 Negotiation 45 60% 300 Proposal 40 40% 250
Forecast: ARR 5 minutes Jan-20 Feb-20 Mar-20 Apr-20 May-20 Jun-20 Jul-20 Aug-20 Sep-20 Oct-20 Nov-20 Dec-20 Original Plan 700 880 1,200 1,350 1,550 1720 1,800 1,980 2,100 2,250 2,450 2,660 New Forecast Jan-20 700 880 1,200 1,350 1,550 1,720 1,800 1,980 2,100 2,250 2,450 2,660 Feb-20 890 1,200 1,350 1,600 1,750 1,800 1,980 2,100 2,250 2,450 2,660 Mar-20 1,195 1,350 1,600 1,700 1,780 1,980 2,100 2,250 2,450 2,660 Apr-20 1,350 1,600 1,700 1,800 1,980 2,100 2,250 2,450 2,660 May-20 1,500 1,680 1,800 1,980 2,100 2,250 2,450 2,660 Jun-20 1,650 1,800 1,980 2,100 2,250 2,450 2,660 Jul-20 1,830 1,980 2,100 2,250 2,450 2,660 Aug-20 1,990 2,100 2,250 2,450 2,660 Sep-20 Oct-20 Nov-20 Dec-20 =FORECAST David Sacks =BEAT ORIGINAL PLAN “I’m a fan of using this waterfall chart to track topline forecast over =MISSED ORIGINAL PLAN time as compared to original plan. I like this tool because it incentivizes operators to reforecast accurately and often; I appreciate when founders do this because it is hard to track what has changed over the course of the year. This keeps everyone on the same page. ”
Sales Update 5 minutes Sales Rep Performance Sales Rep Deals Closed Bookings New ARR Bookings Quota Quota Attained Sales Rep 1 8 $150,000 $75,000 $120,000 125% Sales Rep 2 6 $70,000 $50,000 $60,000 117% Sales Rep 3 7 $110,000 $80,000 $100,000 110% Sales Rep 4 9 $85,000 $50,000 $80,000 106% Sales Rep 5 4 $100,000 $50,000 $100,000 100% Sales Rep 6 3 $180,000 $90,000 $200,000 90% Sales Rep 7 3 $40,000 $40,000 $50,000 80% Sales Rep 8 2 $35,000 $30,000 $50,000 70% Sales Rep 9 2 $60,000 $55,000 $100,000 60% Sales Rep 10 2 $75,000 $65,000 $150,000 50% David Sacks “ I like to review sales rep performance stack ranked by quota attainment. Here, discuss sales team needs and potential hiring plan. ”
Product Update
Product Update 10 minutes Product Priorities ● Releases: what we’ve done ● Roadmap: what we plan to do David Sacks “For board meetings, focus on the major product priorities. You should be able to describe them with a list of bullets on 1 page. Nice to have: mockups of new products.”
Marketing Update (Optional)
Marketing Update 10 minutes Share major news ● Review of launch events ● Results of major campaigns ● New initiatives ● Areas for improvement David Sacks “If you just did a major launch event, tell us how it went. What was the reaction to the product? What are major stakeholders saying?”
Financials 15 minutes Actual and Projected KPIs, Financials, and Fundraising Expectations ($000s) 2018A Q1 2019A Q2 2019A Q3 2019A Q4 2019A 2019A Q1 2020A Q2 2020E Q3 2020E Q4 2020E 2020E 2021E Net New ARR 0 40 175 205 240 240 955 305 400 450 1,630 4,650 ARR 60 100 275 480 720 720 1,195 1,500 1,900 2,350 2,350 7,000 Revenue 25 60 140 180 220 600 $300 400 520 650 $1,870 5,610 Gross Margin -10% -15% -25% -10% 5% -9% 35% 45% 50% 55% 48% 55% Operating Expenses R&D 220 330 495 595 485 1,905 550 500 500 500 2,050 2,700 S&M 100 150 225 330 495 1,200 450 500 550 600 2,100 4,000 G&A 100 150 140 160 200 650 225 220 240 250 935 1,000 Total OpEx 420 630 860 1,085 1,180 3,755 1,225 1,220 1,290 1,350 5,085 7,700 Operating Income -423 -639 -895 -1,103 -1,169 -3,806 -1,120 -1,040 -1,030 -993 -4,183 -4,615 Net Income -428 -639 -895 -1,103 -1,169 -3,811 -1,125 -1,045 -1,035 -998 -4,188 -4,620 Cash 3,000 2,300 1,550 200 5,500 5,500 4,100 2,900 1,900 1,150 1,150 13,150 Debt 0 0 250 500 500 500 500 500 500 750 1,000 Burn -1,200 -700 -1,000 -1,600 -1,700 -5,000 -1,400 -1,200 -1,000 -1,000 -4,600 -8,000 Capital Raise Debt 0 0 250 250 0 0 0 0 0 250 250 0 Equity 0 0 0 0 7,000 7,000 0 0 0 0 0 20,000 David Sacks “After walking through the key departments and team, drop into the financials: what is the status and scale of the business. Here is where you can discuss fundraising plans and major financial items i.e. a focus on improving gross margin.”
Team 15 minutes 1. Current Team headcount 2. Hiring plans and recruiting needs 3. Where we need the most help David Sacks “What does your ideal org chart look like compared to the one you have today? What are the areas that are on fire and have the greatest need for new hires?”
Administrative Matters [Closed Session] 10 minutes Proposed Option Grant Employee Start Date Option Grant % of Pool % Fully Diluted Position Employee 1 10/1/2020 200,000 1% 0.20% Business Operations Employee 2 9/1/2020 500,000 3% 0.50% Dir Engineering Employee 3 9/1/2020 500,000 3% 0.50% Dir PR Option Pool Data Shares % Gross % Fully Diluted Total Pool Size 20,000,000 100.00% 20.00% David Sacks Options Previously Issued 10,000,000 50.00% 10.00% Options Proposed Today 1,200,000 6.00% 1.20% “Handle administrative matters in closed session. Save for the end to avoid wasting time at the Remaining Unissued 8,800,000 50.00% 10.00% beginning of the meeting. Some of this can just be done by docusign.”
Discussion 20 minutes David Sacks “Open ended discussion of the most pressing needs of the business. ”
Appendix

